
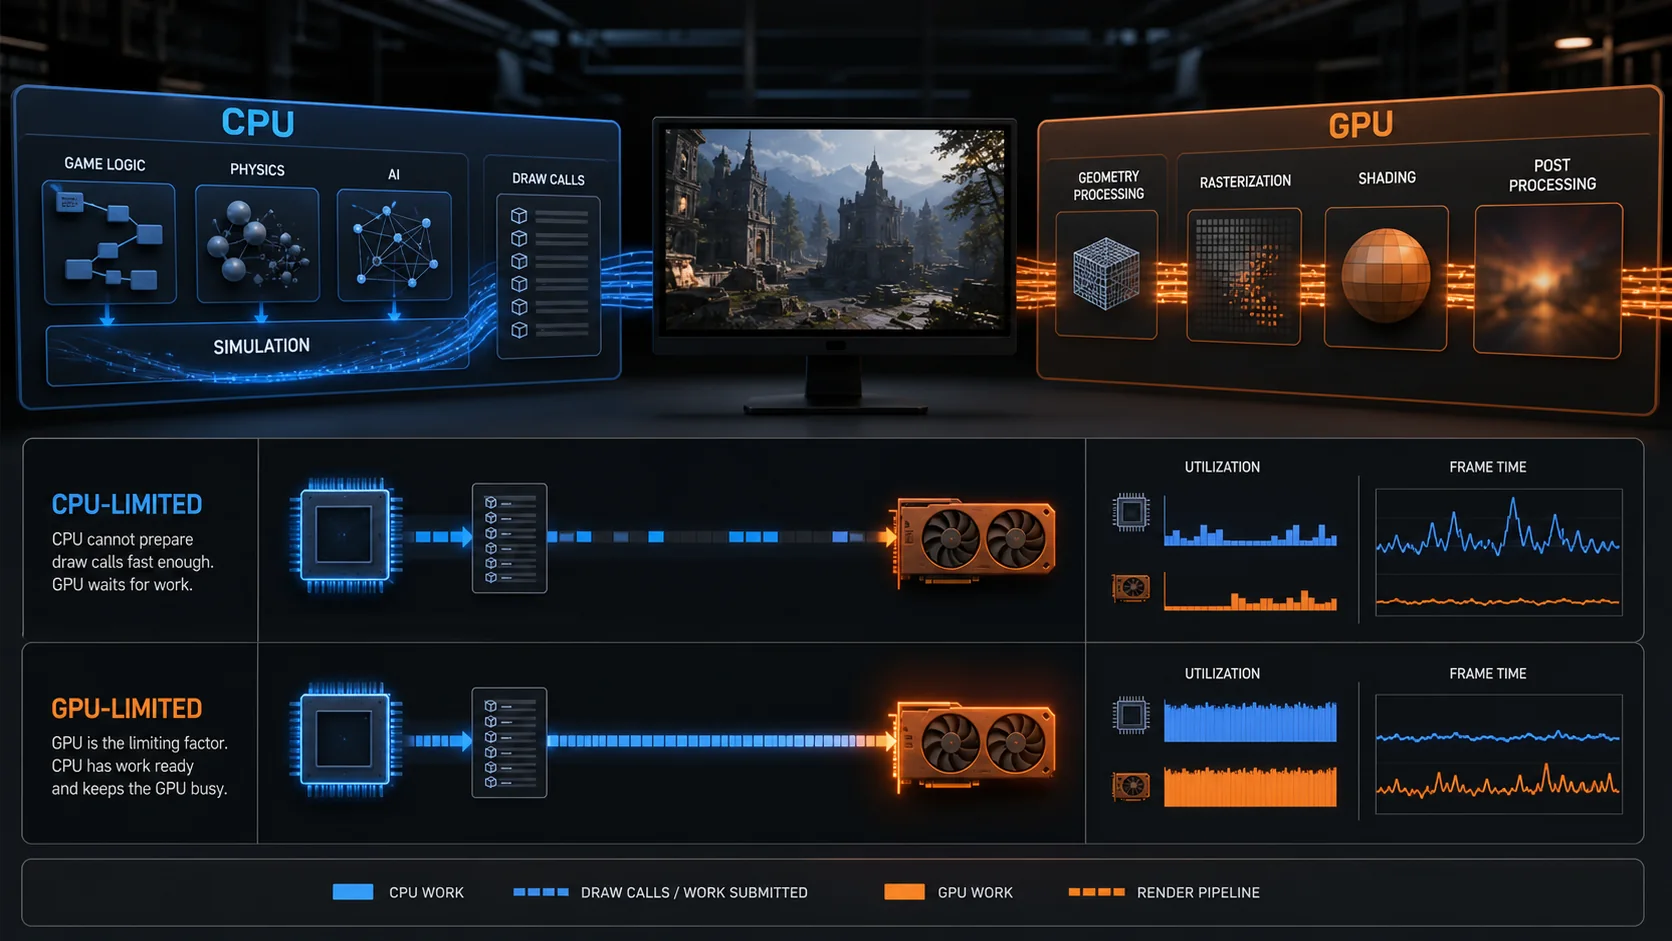
Checking for a GPU or CPU bottleneck with software means monitoring both components’ usage percentages simultaneously during actual gameplay and comparing them against your frame rate, since a component consistently near 100% usage while frame rate stays below your target is typically the limiting factor. Free tools like MSI Afterburner’s overlay or HWiNFO64 provide the real-time data needed to make this determination rather than guessing based on hardware specs alone.
As an Amazon Associate we earn from qualifying purchases at no extra cost to you.


Top 3 picks at a glance
Quick answer
Enable an overlay showing both CPU and GPU usage percentage during gameplay, then watch which one consistently sits near 100% while the other has spare headroom. The component pinned near its ceiling is your bottleneck at that specific resolution and settings — this can change if you adjust resolution, settings, or switch games.
| Pattern observed | Likely bottleneck |
|---|---|
| GPU near 99%, CPU noticeably lower | GPU-bound |
| CPU near 100% on key cores, GPU noticeably lower | CPU-bound |
| Both moderate, frame rate still low | Check RAM, storage, or background load |
Setting up the monitoring overlay
MSI Afterburner’s overlay, covered in our Afterburner setup guide, can display GPU usage percentage, CPU usage percentage, and frame rate simultaneously, giving you the core data needed for bottleneck analysis in one glance during actual gameplay.
HWiNFO64 provides more granular detail, including per-core CPU usage rather than just an overall average, which matters because many games don’t distribute load evenly across all CPU cores — a single overloaded core can bottleneck performance even when overall CPU usage looks moderate on an average reading.
Both tools can run simultaneously without conflict since they read hardware sensors through the same underlying mechanisms rather than competing for exclusive access, so there’s no need to choose one over the other permanently — many players default to Afterburner’s lighter always-on overlay for daily use and open HWiNFO64’s fuller interface specifically when a deeper per-core or per-sensor breakdown is needed for a specific troubleshooting session, closing it again afterward to keep the day-to-day overlay uncluttered.
Configure the overlay to show both metrics clearly and test in the actual game and settings combination you’re trying to evaluate, since bottleneck analysis is specific to a given resolution, settings, and game rather than a universal property of your hardware.
Run the monitoring during a representative, demanding section of the game rather than a loading screen or menu, since usage percentages during non-gameplay moments don’t reflect your real bottleneck during actual play.
If your monitor supports a high refresh rate and you’re testing at a frame rate cap, temporarily removing the cap for this specific diagnostic session gives a clearer picture of each component’s true ceiling — a capped frame rate can make a GPU-bound system look artificially CPU-bound or vice versa, since neither component is being pushed to its actual limit while the cap is holding frame rate below what either could otherwise sustain.
A practical setup tip worth following before you start drawing conclusions: let both usage readings settle for at least thirty seconds to a minute in the actual gameplay scene you’re testing before recording numbers, since usage percentages can swing noticeably in the first few seconds after loading into a new area as shaders compile and assets stream in, which can give a misleadingly high or low initial reading that doesn’t reflect steady-state behavior.
Reading GPU usage percentage correctly
GPU usage consistently at or near 99-100% while frame rate is below your target generally indicates the GPU is the limiting factor — it’s working as hard as it can, and more GPU performance (a better card, higher-quality settings reduction, or upscaling) would likely improve frame rate in that scenario.
GPU usage that fluctuates or sits noticeably below 99%, especially if it dips substantially during specific moments, points away from a pure GPU bottleneck and toward something else — likely a CPU limitation, but potentially a different cause like background software or storage-related stutter during asset loading.
Some games display genuinely variable GPU usage even in a healthy, well-performing state, particularly during scenes with rapidly changing scene complexity, so a brief dip isn’t automatically meaningful — look at sustained patterns over a longer play session rather than a single moment.
A rough interpretive guide worth keeping in mind rather than treating as a strict rule: GPU usage in the high 90s (say, 95% and above) sustained over a demanding scene generally supports a GPU-bound read, while usage that regularly sits in the 70-85% range alongside a frame rate below your target is a stronger signal that something other than raw GPU capability is capping your performance, whether that’s the CPU or one of the less obvious causes covered later in this guide.
Reading CPU usage percentage correctly
Overall CPU usage average can be misleading for bottleneck analysis, since a game engine that’s heavily single-threaded or lightly multi-threaded can max out one or two cores while overall average usage across all cores looks moderate — checking per-core usage in HWiNFO64 gives a more accurate picture than a single averaged number.
A CPU bottleneck typically shows as one or a few cores consistently near 100% while GPU usage sits meaningfully below its own ceiling, indicating the GPU is waiting on the CPU to prepare the next frame’s data rather than being fully utilized itself.
Background applications competing for CPU time can create a false impression of a CPU bottleneck that’s actually caused by something other than the game itself — closing unnecessary background software before testing gives a cleaner read on the game’s actual CPU demand.
Our guide on GPU vs. CPU bottleneck explained covers the underlying concepts in more depth if you want the theory behind what you’re observing in the overlay data.
A concrete example of why the averaged number can mislead: an eight-core CPU where a game’s main thread pins one core at 100% while the other seven sit at 20-30% will report an overall average usage somewhere in the 30-40% range — a number that on its face looks like the CPU has plenty of headroom left, when in reality that single maxed-out core is the actual bottleneck limiting how fast the GPU can be fed new frame data. This is the single most common reason players are confused by “my CPU usage isn’t even that high, so why is my GPU usage low too” — the average is hiding the real story on a per-core basis.
How resolution and settings change the bottleneck
Increasing resolution shifts more rendering workload onto the GPU while leaving CPU demand largely unchanged, since the CPU’s main job is preparing game logic and draw calls regardless of how many pixels the GPU ultimately renders — this is why the same system can be GPU-bound at 4K but CPU-bound at 1080p in the same game.
If you suspect a CPU bottleneck, testing at a lower resolution (even temporarily, just for diagnostic purposes) can help confirm it, since a CPU-bound scenario’s frame rate typically doesn’t improve much when resolution drops, while a GPU-bound scenario’s frame rate rises significantly at lower resolution.
Settings that specifically affect CPU load — draw distance, NPC or object density, some physics settings — behave differently from settings that mainly affect GPU load, like texture resolution or shadow quality, so adjusting the right category of setting matters depending on which component you’ve identified as the bottleneck.
Upscaling technologies add a further wrinkle worth understanding: rendering internally at a lower resolution and upscaling to your display’s native resolution reduces GPU load specifically, without touching CPU load at all, since the CPU still has to prepare the same game logic and draw calls regardless of the GPU’s internal render resolution. If you’re already CPU-bound, enabling upscaling won’t raise your frame rate ceiling, since the bottleneck it addresses isn’t the one currently limiting you — this is a common point of confusion when a player expects upscaling to help and sees little to no change.
A useful diagnostic test that directly exploits this relationship: drop resolution dramatically (for example, from 1440p down to 1080p or even lower, purely as a test rather than something you’d actually play at) and watch what happens to frame rate. If frame rate barely moves despite the large resolution drop, that’s strong confirmation of a CPU bottleneck, since you’ve effectively removed most of the GPU’s workload and the frame rate ceiling didn’t change — meaning something other than the GPU was setting that ceiling all along.
Checking for non-CPU, non-GPU limitations
If neither CPU nor GPU usage is consistently near its ceiling but frame rate is still lower than expected, RAM capacity or speed can be a contributing factor, particularly if the system is also showing high memory usage or swapping to storage during gameplay.
Storage speed can cause frame rate drops or stutter distinct from a steady-state CPU or GPU bottleneck, particularly during asset streaming in open-world games — this shows up as inconsistent stutter rather than a sustained low frame rate, and is a different diagnosis than the usage-percentage pattern covered above.
Background software, including overlays themselves in rare cases, can consume enough resources to create an artificial limitation that isn’t reflected clearly in the CPU/GPU usage pattern you’re monitoring — testing with a minimal set of background applications running helps rule this out.
A concrete way to test the RAM and storage possibility specifically: watch Task Manager’s Memory tab or HWiNFO64’s memory usage readout during the same demanding scene, alongside the disk active-time percentage discussed in our Windows optimization guide. Memory usage sitting close to your total installed capacity, or a disk that’s frequently active during a stutter, points toward those components rather than the CPU or GPU as the actual constraint, even though neither shows up in a standard CPU/GPU usage overlay.
Comparing results against expectations for your hardware
If you’re unsure whether your observed bottleneck pattern is normal for your specific CPU and GPU pairing, comparing against other users’ reported experiences with the same or similar hardware combination, in the same game, gives useful context — though individual system configurations and background software will always introduce some variance.
A significant CPU bottleneck with a relatively modern, capable CPU paired against a much more powerful GPU is a mismatch worth being aware of when planning future upgrades, since adding more GPU power in that scenario wouldn’t meaningfully improve frame rate until the CPU limitation is addressed.
Our guide on when to upgrade your graphics card is relevant here if your bottleneck analysis is feeding into an upgrade decision rather than just general curiosity about your system’s behavior.
It’s also worth checking your bottleneck pattern against more than one game before drawing a broad conclusion about your system as a whole. A single CPU-bound result in one particularly CPU-heavy title (a large-scale strategy game or simulation, for example) doesn’t mean your whole library is CPU-limited — testing two or three games spanning different genres and demands gives a more representative picture of where your system’s actual balance sits than one result taken in isolation.
If you’re specifically comparing your results against a friend’s or a reviewer’s system with nominally similar hardware, remember that background software, Windows version, driver version, and even case airflow differences can all shift the exact numbers by a meaningful margin — treat any such comparison as a rough sanity check rather than an expectation that your numbers should match exactly.
When bottleneck analysis doesn’t explain your performance
If frame rate is inconsistent (stuttering) rather than just lower than expected on average, that’s a different diagnostic path than steady-state bottleneck analysis — check our guide on fixing FPS drops, since stutter often has a different root cause than a sustained CPU or GPU ceiling.
If a specific game performs unusually poorly compared to similarly demanding titles on the same hardware, a game-specific optimization issue or bug is a more likely explanation than a genuine hardware bottleneck, and checking that game’s known issues is worth doing before assuming your hardware is the problem.
Driver-level issues can also masquerade as a bottleneck pattern that doesn’t respond the way you’d expect to settings changes — if lowering graphics settings doesn’t meaningfully change GPU usage or frame rate the way a genuine GPU bottleneck should, an outdated or corrupted driver is worth ruling out through the clean reinstall process in our GPU driver update guide before concluding your bottleneck analysis itself is somehow wrong.
Troubleshooting bottleneck monitoring
Overlay shows 0% or missing GPU usage: this can indicate the monitoring tool isn’t reading the correct GPU, particularly on laptops or systems with both integrated and dedicated graphics — confirm the game is actually running on the dedicated GPU you intend to monitor.
CPU usage looks low overall but performance is still poor: check per-core usage rather than the overall average, since a single maxed-out core can bottleneck a game even when the average across all cores looks unremarkable.
Usage percentages look normal but frame rate is still below expectations: consider RAM, storage, or background software as contributing factors rather than assuming the monitoring data is wrong — a clean bottleneck pattern isn’t always present even when a real limitation exists.
Numbers seem inconsistent between different monitoring tools: minor differences in sampling method and averaging period between tools are normal — use one tool consistently for a given comparison rather than switching between tools mid-analysis.
Frequently asked questions
What does it mean if my GPU usage is at 99% and CPU usage is lower?
This generally indicates your GPU is the limiting factor, since it’s working at full capacity while the CPU has spare headroom. This is often described as being GPU-bound, and it’s the expected, healthy state for a well-balanced system at higher resolutions or settings.
Is a CPU bottleneck always a bad thing?
Not necessarily. If your GPU usage is lower than 99% and frame rate is still meeting your target, a CPU bottleneck at that specific frame rate isn’t actually holding you back from what you’re trying to achieve — it only matters if you want more frames than you’re currently getting.
Why does my bottleneck change between different games?
Different games have different CPU and GPU demands based on their engine, world complexity, and settings, so a system that’s GPU-bound in one demanding, graphically intensive title can be CPU-bound in a different, more CPU-heavy title like a simulation or strategy game.
Does resolution affect which component bottlenecks first?
Yes, significantly. Higher resolutions shift more of the workload onto the GPU, making a GPU bottleneck more likely, while lower resolutions reduce GPU demand and can expose a CPU bottleneck that wasn’t visible at a higher resolution.
Can a bottleneck be caused by something other than the CPU or GPU?
Yes. RAM capacity or speed, storage speed for texture streaming, and even background software competing for resources can all contribute to a performance limitation that isn’t purely a CPU or GPU issue in the traditional sense.


