A GPU tier list is a ranking that sorts graphics cards into performance bands, so that every card inside a band delivers roughly the same frame rate in the same games at the same resolution. It is a shortcut for a question nobody wants to answer with forty benchmark charts: is this card in the same class as that one, or a full step above it?
I am Priya Raghunathan, and I have spent eight years as a GPU and CPU analyst pulling cards apart on an instrumented bench with a PCIe riser, a clamp meter and per-rail power logging. The riser matters because it lets me measure slot power separately from the cable feed, and the logging matters because a card’s tier changes depending on whether you look at its average frame rate or the frames it drops when the VRAM buffer fills. What follows is how these ladders are built, what they hide, and how to work out where your own card sits without trusting anyone’s colored chart on faith.
The Definition, Without the Marketing Layer
Strip away the presentation and a tier list is a normalization exercise. One card is picked as the anchor and assigned 100 percent. Every other card is expressed as a percentage of that anchor across a fixed suite of games at a fixed resolution and preset. Cards that land within roughly eight percent of each other are grouped into one tier, because eight percent is around the point where the difference stops being visible in normal play and starts being a benchmark bar length.
That eight percent grouping is not arbitrary. In my own blind comparisons on a 165 Hz panel, testers reliably picked the faster system when the gap was 15 percent or more, split roughly evenly at 10 percent, and guessed at random below 7 percent. A tier boundary is meant to sit where the difference becomes perceptible, not where the model numbers happen to change.
The naming conventions vary. Some lists use letters, running from S at the top through A, B, C and D. Some use plain labels: halo, enthusiast, high end, mainstream, entry. Some just use resolution targets, which is honestly the most useful framing for a buyer. The labels are cosmetic; the underlying percentages are what you should read.
How I Build Tiers on the Bench
My suite runs twelve games, chosen so that no single engine dominates the average. Four are heavy rasterization titles with large open worlds, three are competitive shooters that stress CPU and driver overhead, three lean on ray tracing, and two are engine-heavy simulation titles that punish VRAM. Each game runs three passes of a 90 second captured segment, and I throw out the first pass because shader compilation stutter contaminates it.
I log average fps, 1% lows and 0.1% lows separately. Averages decide the rough band; the lows decide whether a card stays in that band. A card that averages 96 fps with 1% lows of 71 is a materially better experience than one averaging 99 fps with 1% lows of 48, and the second card gets demoted regardless of its bar length. If you want the deeper explanation of that distinction, I wrote it up in one percent lows versus average fps.
Power gets logged the whole time through the riser and the clamp meter, sampled at 10 ms. That sampling rate exists because transient spikes on modern cards last a few milliseconds and never show up in software readouts. A card whose board power reads 285 W in the driver overlay can pull past 400 W for a handful of milliseconds, and that number decides which power supply belongs with it.
The Ladder, Band by Band
Here is the shape of a current ladder expressed in the terms that matter to a buyer. Percentages are relative to a common upper mid-range anchor set at 100.
| Tier | Relative performance | Comfortable target | Typical board power | Typical street price |
|---|---|---|---|---|
| Halo | 190-230% | 4K 120 Hz, heavy ray tracing | 450-575 W | $1,700-2,400 |
| Enthusiast | 140-170% | 4K 60-90 Hz, 1440p high refresh | 300-400 W | $900-1,300 |
| Upper mid-range | 95-120% | 1440p 100-144 Hz | 220-300 W | $500-750 |
| Mainstream | 70-90% | 1440p 60-90 Hz, 1080p high refresh | 160-220 W | $300-450 |
| Entry | 45-65% | 1080p 60 Hz, esports at high refresh | 100-160 W | $180-280 |
| Basic | 25-40% | 1080p medium, light titles | 50-100 W | under $180 |
Notice how the price column climbs faster than the performance column. Moving from mainstream to upper mid-range costs roughly 60 percent more money for around 30 percent more frames. Moving from enthusiast to halo costs 80 percent more for 35 percent more. That curve is the single most important thing a tier list teaches, and it is the reason I tell people to buy the lowest tier that clears their monitor rather than the highest tier they can finance.
Tiers Are Resolution-Dependent, Which Breaks Most Lists
A single ladder implies a single order, and that is not how these cards behave. At 1080p, the ranking compresses badly because the processor becomes the limiter; two cards separated by 30 percent at 4K can land within 6 percent of each other at 1080p on a mid-range CPU. At 4K, memory bandwidth and VRAM capacity stretch the gaps back open, and cards with narrow memory buses fall a full tier.
In practice I keep three ladders, not one. The 1080p ladder rewards driver overhead efficiency and clock speed. The 1440p ladder is the most stable and the one most tier lists implicitly describe. The 4K ladder rewards bandwidth and buffer size, and it is where an eight gigabyte card that looked fine in the mainstream band drops two positions because it is swapping textures.
If a list does not state its resolution in the first line, it is not telling you enough to act on. Ask which panel it assumes before you compare your card against it.
Where Tier Lists Quietly Mislead
The first distortion is upscaling. If a suite runs quality-mode upscaling on every title, cards render at a lower internal resolution and the ranking shifts toward whichever architecture has the better temporal reconstruction. That is a legitimate way to play, but it is not the same measurement as native rendering, and mixing the two inside one list produces an order that matches no real configuration.
The second is ray tracing weight. Three ray traced titles out of twelve produce one order; six out of twelve produce a visibly different one, with some cards moving a full tier. Neither is wrong. You simply need to know which one you are reading, and pick the list whose game mix resembles your library.
The third is VRAM cliff behavior. A card with a buffer that is just barely adequate looks completely healthy in a 90 second benchmark run and falls apart after 40 minutes in a large open world as the buffer fragments. Short benchmark passes systematically overrate these cards. I catch it by running a 30 minute soak on two titles per generation and comparing the 0.1% lows at minute two against minute twenty-eight; a healthy card drifts under 5 percent, a buffer-starved one can drop 25 percent or more.
The fourth is the review-sample lottery. Board partner cards shipped to reviewers are often the highest factory overclock in the lineup, running a 3 to 6 percent advantage over the base model that most people buy. If a tier boundary is 8 percent wide, a 6 percent sample advantage can push a card into a band it does not belong in.
Power Draw Belongs in the Tier, Not the Footnote
Two cards can sit in the same performance band and be a hundred watts apart. That difference lands in your power supply budget, your case temperature, your fan noise and your electricity bill, and it deserves to be part of how you read the ladder.
My clamp meter readings on recent silicon show a consistent pattern: within a tier, the card drawing 60 to 80 W less usually runs 6 to 9 degrees cooler under sustained load and roughly 4 to 7 dBA quieter at the same fan curve. Over a three hour session in a small room, that is the difference between a machine you forget about and one you are aware of.
Transients matter more than nameplate figures. A 250 W nameplate card that spikes to 360 W for two milliseconds can trip the over-current protection on a tightly specified power supply even though the average draw is nowhere near the rating. My rule after measuring a few dozen of these: size the supply at roughly 1.7 times the card’s rated board power plus the processor’s sustained draw, then round up to the nearest common wattage. The reasoning is laid out in more detail in GPU power supply requirements explained.
The Compatibility Trap: Clearance and Slots
This is the part where tier lists are silent and buyers get hurt, so I will state the principles plainly and then tell you exactly what to check.
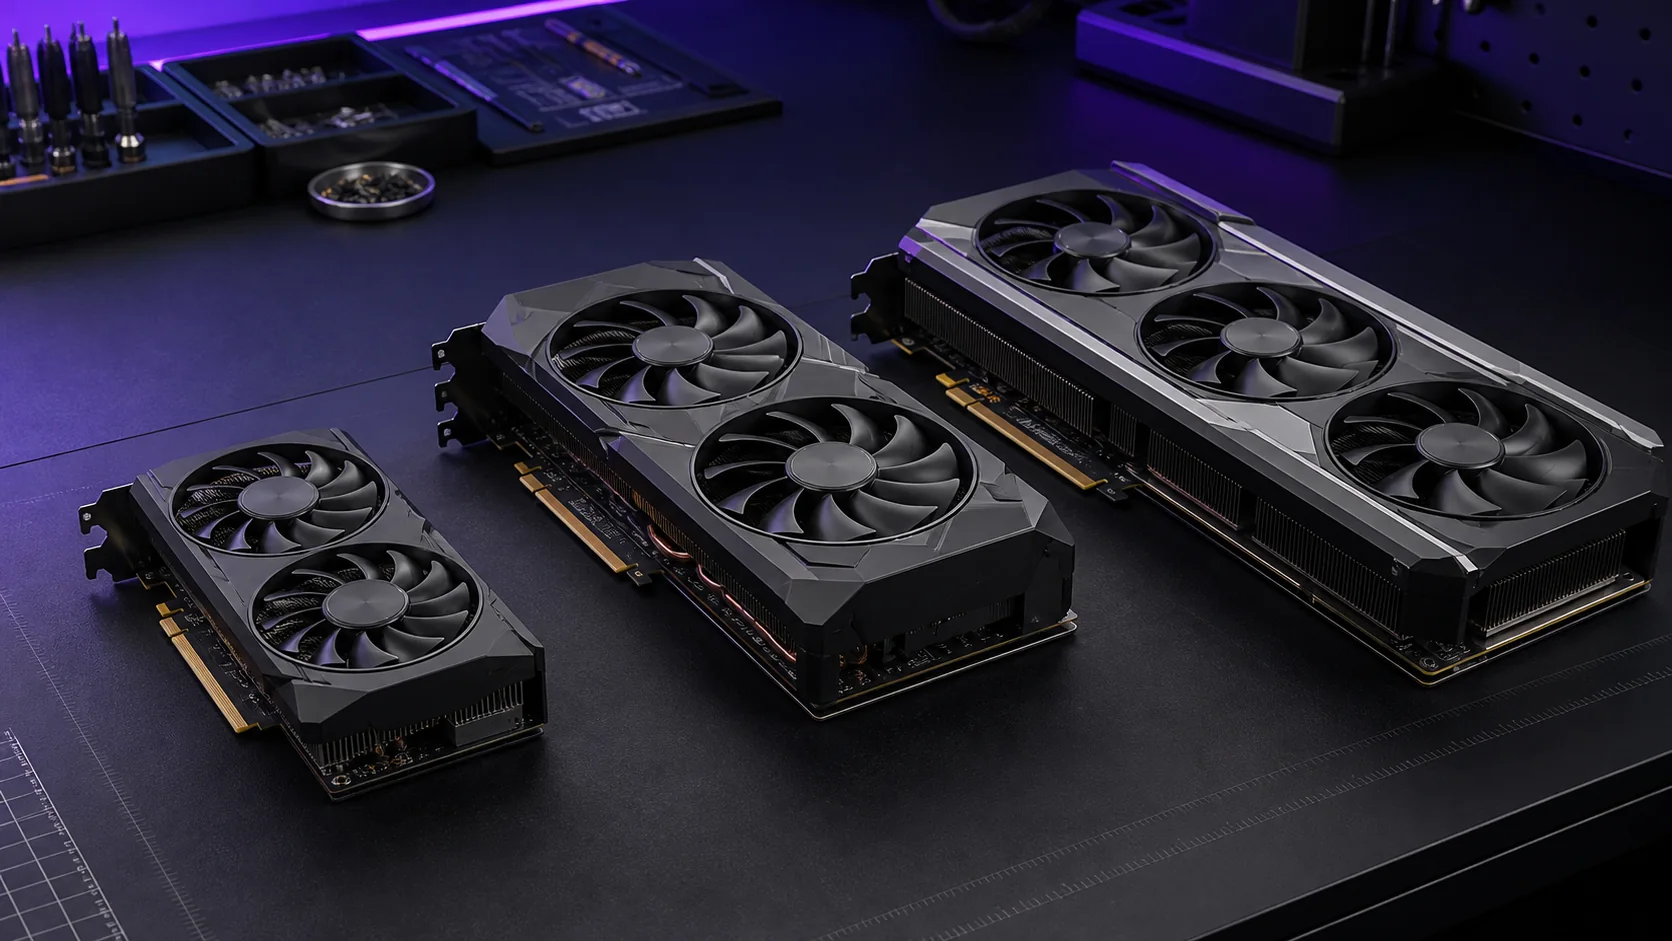
Physical clearance has three independent dimensions and all three must pass. Length is the obvious one, measured from the bracket to the far end of the shroud, and it must clear your front fans or radiator, not just the case’s advertised maximum. Height, meaning the distance from the slot to the top edge of the card, matters because many modern cards are taller than the standard bracket and can foul a side panel or a cable channel. Slot width is the third: a card described as three slot occupies three expansion slot openings, but its cooler may physically overhang into a fourth, blocking whatever sits below it.
Above all of that sits connector clearance. The power connector on most current cards points upward or backward, and it needs 35 to 50 mm of free space beyond the card body for the cable’s bend radius. A card that technically fits a case with 5 mm to spare will not close its side panel once the cable is attached. The principle: budget for the card plus the cable, never the card alone.
Socket and slot compatibility follows the same logic. A modern card is keyed for a PCI Express x16 slot and will run in any x16 physical slot, but the electrical width of that slot varies by motherboard, and a slot wired for four lanes will cost you real frames on a high tier card while costing an entry card almost nothing. Older platforms with earlier PCIe generations halve the per-lane bandwidth, which compounds the problem on cards that ship with only eight electrical lanes.
My standing instruction to readers: do not trust a tier list, a forum post or this article for fit. Open the manufacturer’s specification table for the exact model number printed on the box, read the length, height and slot count from that table, then measure your own case interior with a tape measure and compare the two numbers yourself. Board partners ship the same GPU in bodies that differ by 90 mm and a full slot, so the chip name tells you nothing. The same discipline applies to the motherboard manual’s slot bandwidth table, which will tell you which slot runs at full x16 and which drops to x4 when a storage device is installed. Cross-check both tables before you buy; that five minute exercise prevents the most common and most expensive mistake in this hobby. If you want the step by step, how to choose a graphics card walks through the measurements in order.
Cost Per Frame: The Number That Decides Everything
Divide street price by average fps at your resolution and you get a value figure that cuts through tier labels entirely. Run it across a current lineup and the shape is always the same: value peaks somewhere in the mainstream or lower upper mid-range band and degrades in both directions.
| Tier | Example price | Average fps at 1440p high | Cost per frame |
|---|---|---|---|
| Halo | $1,999 | 178 | $11.23 |
| Enthusiast | $1,099 | 142 | $7.74 |
| Upper mid-range | $599 | 108 | $5.55 |
| Mainstream | $379 | 84 | $4.51 |
| Entry | $249 | 58 | $4.29 |
| Basic | $169 | 34 | $4.97 |
The dip at the bottom is real: the cheapest cards carry fixed costs, a board, a cooler, a bracket, that do not shrink with the chip, so value turns back down. The practical read is that the two middle rows are where most people should shop, and that jumping to the top row costs you more than double per frame for a card that will still be replaced in the same upgrade cycle.
Last-Generation and Used Cards Inside the Ladder
A tier list built only from current products throws away the best value in the market. A previous generation enthusiast card frequently lands in the same band as a current upper mid-range card while selling for 30 to 40 percent less on the second-hand market. It will draw more power and lack the newest upscaling features, but the frames are the frames.
The tradeoffs are concrete. Older silicon typically runs 40 to 90 W hotter for the same output, carries no remaining warranty, and may have spent its life at high temperature. On the bench I check used cards by logging memory junction temperature during a 20 minute loop; a card whose memory crosses 96 C with the fans at full speed has thermal pad degradation and is not the bargain it looks like. Repasting and repadding usually recovers 8 to 14 degrees, which is worth an afternoon on a card you paid half price for. There is more on that evaluation process in best used graphics card to buy.
Placing Your Own Card on the Ladder
You do not need my bench to do this. Pick two games you actually play, set them to the resolution and preset you actually use, and record average and 1% low frame rates over a repeatable five minute route with an overlay. Then find any published tier list that uses a similar preset and resolution and locate the card whose numbers match yours within eight percent. That is your tier, measured rather than assumed.
Two cautions. First, make sure the processor is not the limiter, or you will place yourself far too low; if GPU utilization sits below 95 percent during the run, you are measuring the wrong component. Second, run the test after a driver clean install, because a driver stack layered through three generations can cost several percent on its own.
What the Tiers Do Not Capture
Three attributes decide daily satisfaction and never appear in a ranking. Cooler acoustics is the first: two cards in the same band, at the same power, can differ by 8 dBA because one uses a thicker fin stack and a lower fan curve. I record noise at 50 cm with the case panel on, and the spread within a single tier is routinely larger than the performance spread between adjacent tiers.
Display output configuration is the second. Cards in the same band ship with different port counts and different maximum refresh support per port. If you run three monitors, one of them at high refresh over a specific port standard, the tier tells you nothing about whether the card can actually drive that arrangement. Check the port table on the product page for the exact model, not the reference design.
Idle and light-load power is the third, and it is the one people forget because benchmarks only measure load. Multi-monitor setups with mismatched refresh rates can hold memory clocks at maximum, which on some cards means 35 to 55 W at the desktop instead of 12 W. Over a machine that idles eight hours a day, that gap dwarfs the difference in gaming efficiency between two cards in the same tier. Driver updates fix these cases irregularly, so verify it on your own configuration rather than assuming it is solved.
Reading a Tier List Without Getting Sold Something
Four questions answer whether a list deserves your trust. Which resolution and preset produced the numbers? How many games, and what is the engine mix? Was upscaling on or off, and consistently? When were the numbers last retested against current drivers and current prices?
A list that answers all four is a useful map. A list that answers none is a hierarchy of model numbers dressed up as data, and the model numbers were chosen by marketing departments who would very much like you to buy a tier higher than you need. The ladder exists so you can find the rung that clears your monitor, check that the card physically fits the box you own, and then stop thinking about it for four years.