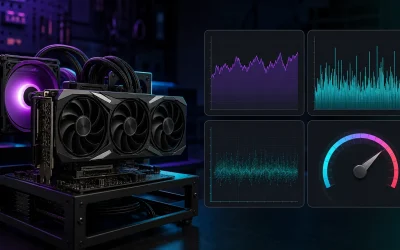
Average frames per second describes throughput, but it does not show whether frames arrive evenly. A game can report a high average while still feeling uneven when occasional frames take much longer to render. That is why useful performance reviews pair average FPS with frame-time data and low-percentile results.
Our Top Picks
 GIGABYTE Radeon RX 9070 XT Gaming OC 16GRADEON9070XT11.34 x 5.2 x 2.2 inches3.9 PoundsCheck on Amazon
 ASUS Prime Radeon RX 9070 EVO 16GB GDDR6RX9070|OC|16GB|EVO|Black12 x 5 x 0.1 inches2.4 PoundsCheck on Amazon
 ASUS Prime Radeon RX 9070 XT 16GB GDDR6RX9070XT|OC|Black12.3 x 5.1 x 2 inches3.3 poundsCheck on Amazon
 ASUS TUF Gaming GeForce RTX™ 5080 16GB GDDR7RTX5080|OC13.7 x 5.7 x 2.8 inches5 PoundsCheck on Amazon
Top 3 picks at a glance
What 1% low FPS means
A 1% low result summarizes performance near the slow end of a benchmark run. The exact calculation depends on the tool, so results from different publications should not automatically be combined. NVIDIA FrameView, for example, distinguishes percentile FPS and averages of the slowest samples in its exported metrics. Always read the benchmark methodology before comparing numbers.
The practical interpretation is simple: when the low result stays reasonably close to the average, delivery is more consistent. A large gap suggests that some frames take substantially longer than normal. Those slow frames may be infrequent, but they can still interrupt aiming, camera movement, or animation.
Frame time is the clearer view
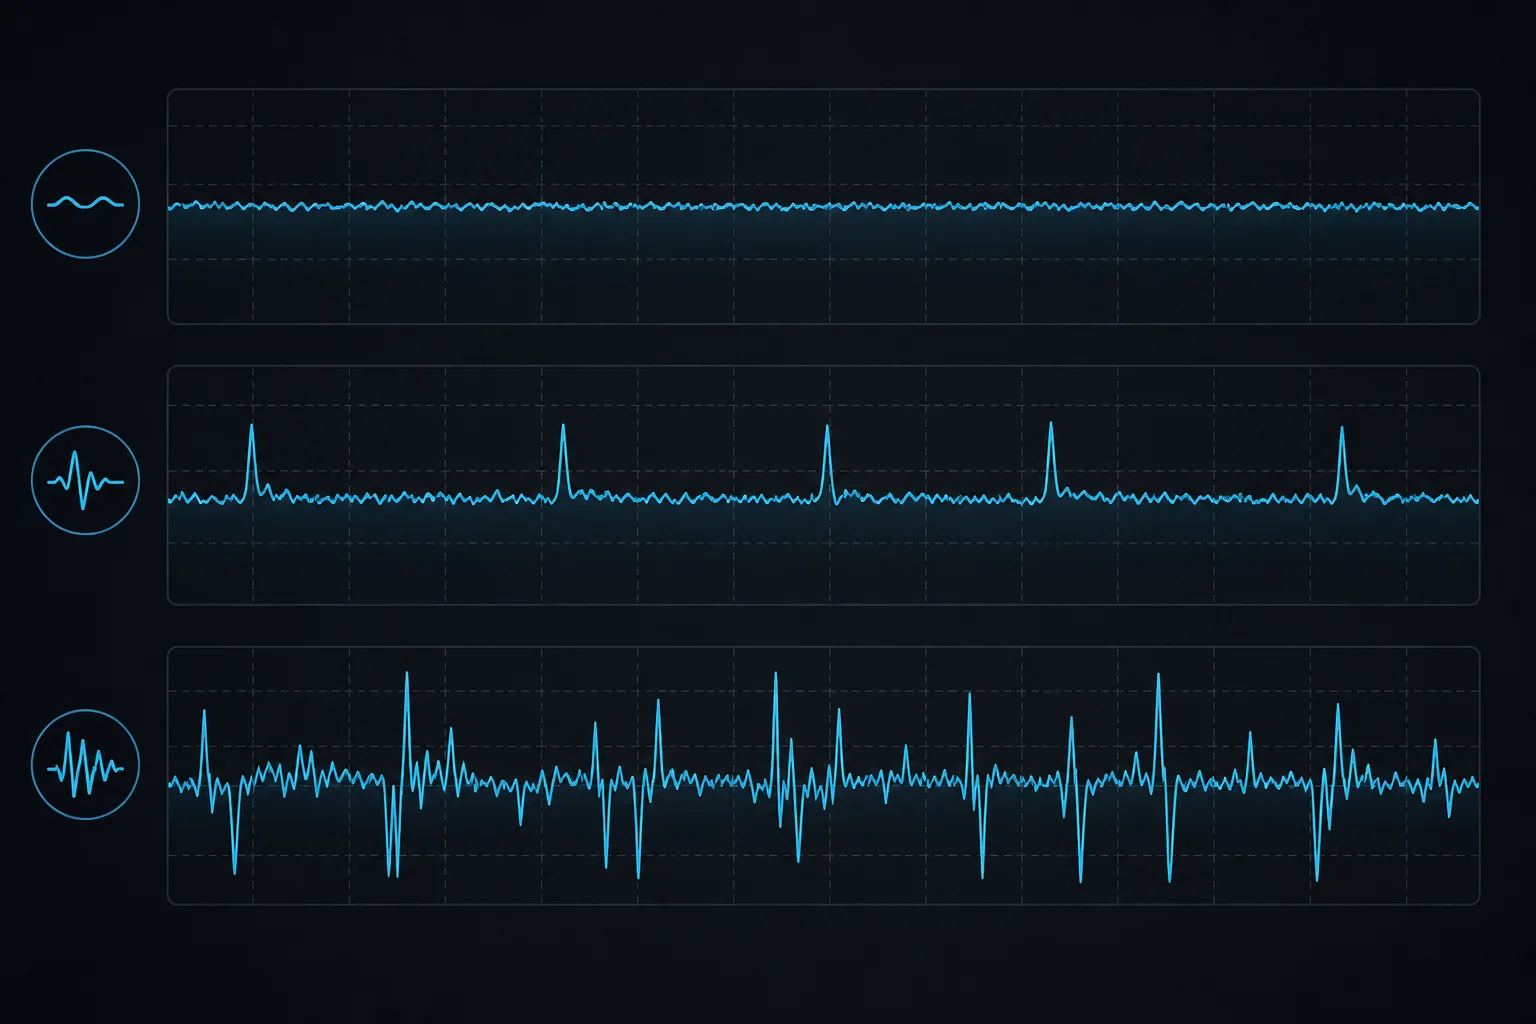
Frame time measures how long each frame takes to complete, usually in milliseconds. A frame-time graph exposes the sequence that an FPS average hides. A mostly flat trace indicates consistent delivery. Tall isolated peaks indicate hitches. A broad rise can show a sustained performance limit rather than a single interruption.
Frame rate and frame time are two views of the same process, but frame time is easier to diagnose because it preserves timing and order. Do not judge a system from one worst frame: loading screens, benchmark transitions and background tasks can create outliers that are not representative of normal play.
What commonly causes poor lows
- Shader compilation when a game encounters new effects
- Asset streaming from storage or decompression work on the CPU
- VRAM pressure that forces data movement
- Background updates, recording software or security scans
- Thermal or power limits that reduce clock speed
- Driver, game-engine or overlay conflicts
A low GPU utilization reading does not prove that the GPU is faulty. A CPU thread, frame-rate cap, game engine, storage event or synchronization step may be holding the pipeline. Compare CPU/GPU utilization, temperature, clock, VRAM use and frame time over the same capture.
How to run a repeatable test
- Use the same game version, driver, save point and graphics settings.
- Warm the system with one preliminary run.
- Record several runs of equal duration.
- Exclude menus and loading transitions consistently.
- Report average FPS, lows and a frame-time plot together.
- Note the CPU, GPU, memory, resolution and power profile.
For troubleshooting, change one variable at a time. Disabling every overlay and changing five graphics settings at once may improve the result, but it will not reveal the cause.
When average FPS is still useful
Average FPS remains valuable for comparing overall rendering capacity in a controlled workload. It becomes misleading only when presented alone. Two systems with the same average can feel different if one delivers frames smoothly and the other alternates between fast and slow frames.
Poor 1% lows usually trace back to a CPU or GPU that cannot hold pace with the rest of the system. If testing points that way, these are the parts worth looking at.
As an Amazon Associate we earn from qualifying purchases at no extra cost to you.



Source and methodology note
This explainer is research-based. Metric terminology was checked against the NVIDIA FrameView user guide. It does not claim an original hardware benchmark.
Frequently asked questions
Can I compare 1% low results from different benchmark tools?
Not safely without checking how each tool calculates the result. The exact calculation varies, and the article notes that NVIDIA FrameView distinguishes percentile FPS from averages of the slowest samples in its exported metrics. Check each benchmark’s methodology before combining or comparing low-percentile figures.
What does a large gap between average FPS and 1% lows suggest?
It suggests that some frames take substantially longer to render than normal. Those slow frames can interrupt aiming, camera movement, or animation even if they happen infrequently. The gap is a useful signal of uneven delivery, but a frame-time plot can help show when the slow frames occur.
Should I treat the single worst frame as representative?
No. A worst-frame spike may come from a loading screen, benchmark transition, or background task rather than normal play. Look at the frame-time sequence and repeatable runs instead of drawing conclusions from one outlier.
Does low GPU utilization mean my graphics card is faulty?
No. Low GPU utilization does not prove a fault. A CPU thread, frame-rate cap, game engine, storage event, or synchronization step may be holding up the pipeline. Compare utilization, temperature, clock, VRAM use, and frame time over the same capture to investigate.
Why can two systems with the same average FPS feel different?
Because average FPS does not show whether frames arrive evenly. One system may deliver frames smoothly, while another alternates between fast and slow frames. Frame-time data and low-percentile results reveal differences in consistency that the average alone can hide.