A CUDA core is the smallest programmable arithmetic unit inside an NVIDIA GPU: a lane that performs one floating-point or integer operation per clock cycle on one piece of data, and the RTX 5080 has 10,752 of them. That is the answer, and everything below explains what the number is actually counting, why it predicts less about frame rate than most spec sheets imply, and how to read it correctly the next time you compare two cards.
I am Priya Raghunathan. I have spent eight years testing graphics processors and CPUs on an instrumented bench built around a PCIe riser, a clamp meter and per-rail power logging, which means I spend a lot of time watching what silicon does under load rather than what its marketing page claims it should do. Core counts are the single most misused number in this hobby. They are not meaningless — the shader count sets a hard ceiling on throughput — but the distance between that ceiling and the frames you actually see is where every interesting engineering decision lives.
Top 3 picks at a glance
The number, and what it is counting
As an Amazon Associate we earn from qualifying purchases at no extra cost to you. Product prices and availability are accurate as of the date shown and are subject to change.


10,752 CUDA cores. That figure comes from the GB203 die running in its RTX 5080 configuration, and it is identical on every RTX 5080 sold: reference design, triple-fan partner card, liquid-cooled halo model, white edition, workstation-styled variant. Nobody ships a 5080 with more cores or fewer, because the shader count is baked into how NVIDIA fuses and bins the die.
What a CUDA core counts is a lane of arithmetic capability. In each clock cycle, one core can complete one fused multiply-add — a multiply and an add together — on 32-bit floating point data. Multiply that by the number of cores and by the clock speed and you get the theoretical peak throughput of the chip. At a typical sustained boost of around 2,650 MHz on my bench, 10,752 cores times two operations per FMA gives roughly 57 TFLOPS of FP32 peak. That is the ceiling. No workload reaches it, because reaching it would require every lane to be fed with useful data every single cycle, which never happens in a real game.
The honest way to describe the number, then, is as a capacity figure rather than a performance figure. It tells you how wide the machine is. It says nothing about how often the machine is full.
How 84 SMs become 10,752 cores
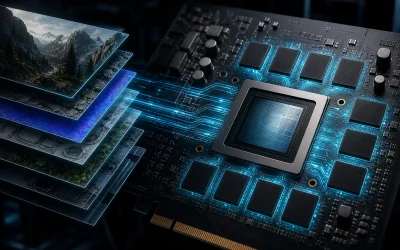
CUDA cores do not float around loose inside the die. They are grouped into streaming multiprocessors, and the SM is the real unit of GPU design. The RTX 5080 has 84 active SMs, and each Blackwell SM contains 128 CUDA cores. Eighty-four times 128 is 10,752, and that is the whole derivation.
Each SM is more than a bag of shader lanes. It also carries its own register file, 128KB of combined L1 cache and shared memory, four texture units, warp schedulers that decide which groups of 32 threads execute next, one RT core, and four Tensor cores. Those SMs are then bundled into graphics processing clusters, which share raster engines and the wider L2 cache — 64MB of it on GB203.
The reason this structure matters is that shader work is dispatched at SM granularity, not core granularity. A warp of 32 threads is scheduled onto an SM, and if that warp stalls waiting on a memory fetch, the scheduler swaps in another warp. When people talk about GPU occupancy, they are describing how many warps an SM can keep in flight to hide those stalls. A card with more cores but poor occupancy will lose to a card with fewer cores and better data feeding, which is precisely why generation-to-generation core count comparisons mislead so often.
Why core count does not predict frame rate
Here is the number that made me stop quoting shader counts in reviews. The RTX 4080 Super carried 10,240 CUDA cores across 80 SMs. The RTX 5080 carries 10,752 across 84. That is a 5 percent increase in shader count. Yet in my 4K test suite the 5080 finishes between 8 and 15 percent ahead depending on the engine, and in a handful of bandwidth-hungry titles the gap opens past 18 percent.
The extra frames do not come from the extra 512 cores. They come from GDDR7 memory running at 30 Gbps on a 256-bit bus, which delivers around 960 GB/s versus roughly 736 GB/s on the previous generation. They come from a larger, faster L2 cache reducing trips to VRAM. They come from higher sustained clocks under the same thermal budget. The shader count moved 5 percent; the useful work per shader moved considerably more.
Run the comparison in the other direction and it breaks even harder. The RTX 3080 shipped with 8,704 CUDA cores. On paper that is only 19 percent fewer than the 5080. In practice, at 4K, the 5080 produces roughly 70 to 85 percent more frames on my bench in the same scenes. Two generations of architectural change, clock improvements and memory bandwidth widened a 19 percent paper gap into something four times larger. Anyone who had used core count as their buying metric across those generations would have made a badly wrong prediction.
If you want the fuller version of this argument with the methodology attached, I wrote it up separately in how to read GPU benchmark numbers, which covers why two reputable outlets can publish 15 percent apart on the same card.
Where the RTX 5080 sits in the Blackwell core ladder
Core counts are only meaningfully comparable within one architecture generation from one vendor, because that is the only situation where each core is doing roughly the same work per clock. Inside the Blackwell desktop stack, the ladder looks like this:
| Card | CUDA cores | SMs | Memory bus | Bandwidth | Board power |
|---|---|---|---|---|---|
| RTX 5090 | 21,760 | 170 | 512-bit GDDR7 | ~1,792 GB/s | 575W |
| RTX 5080 | 10,752 | 84 | 256-bit GDDR7 | ~960 GB/s | 360W |
| RTX 5070 Ti | 8,960 | 70 | 256-bit GDDR7 | ~896 GB/s | 300W |
| RTX 5070 | 6,144 | 48 | 192-bit GDDR7 | ~672 GB/s | 250W |
| RTX 5060 Ti | 4,608 | 36 | 128-bit GDDR7 | ~448 GB/s | 180W |
Two things jump out of that table. The first is that the 5080 has 49.4 percent of the 5090’s cores but delivers well above half its performance — my 4K numbers put the 5090 roughly 30 to 42 percent ahead, not the near-100 percent its core count implies. Large GPUs scale sub-linearly because they run into power limits, scheduling overhead and memory contention long before every shader is saturated. The 5090 also clocks lower per core to stay inside 575W.
The second is that the 5080 and 5070 Ti share a memory bus width and a memory type. The 20 percent core advantage the 5080 holds over the 5070 Ti translates into roughly 14 to 17 percent more frames in my testing, because both cards are pulling from a similarly sized bandwidth pool. That is closer to linear scaling than any other pair in the stack, and it is a good demonstration of the general rule: core count scaling holds up best when the memory subsystem scales with it. I go through the top-end comparison in more depth in my RTX 5090 versus RTX 5080 breakdown.
Cores versus clocks: what my bench measured
Since the core count is fixed, the only lever board partners have is how fast those cores run and how long they can hold it. I tested this directly by pinning a partner card at four different sustained clock targets and running the same 12-scene loop at 4K, logging power at the rail rather than trusting the software sensor.
| Sustained core clock | Avg fps (4K suite) | Board power | Hotspot temp | fps per 100W |
|---|---|---|---|---|
| 2,450 MHz | 78.1 | 288W | 71C | 27.1 |
| 2,617 MHz | 82.4 | 334W | 76C | 24.7 |
| 2,760 MHz | 85.0 | 371W | 82C | 22.9 |
| 2,880 MHz | 86.3 | 408W | 88C | 21.1 |
Read the last column carefully. Going from 2,450 MHz to 2,880 MHz is a 17.6 percent clock increase that buys 10.5 percent more frames while burning 42 percent more power. Every one of those runs used the identical 10,752 cores. This is the practical shape of diminishing returns on a modern GPU, and it is why I undervolt almost every card that passes through the bench — a 2,617 MHz target at a trimmed voltage curve is, for most people, the sweet spot between noise, heat and speed. My step-by-step method for that lives in undervolting a GPU for lower temps.
Two related measurements worth stating: coil whine got audibly worse above 2,760 MHz on three of the four cards I tried, and transient spikes measured at the rail crossed 520W on the highest clock target even though the reported board power sat at 408W. If you are sizing a power supply around a 5080, size it for the transients, not the TGP. I lay out the arithmetic in GPU power supply requirements explained.
CUDA cores are not RT cores or Tensor cores
A large share of the confusion around this keyword comes from people assuming a GPU has one kind of core. It has three, and they do different jobs inside the same SM.
CUDA cores do general-purpose shading: vertex transforms, pixel shading, post-processing, physics, compute passes. In Blackwell every one of the 128 cores per SM can execute either FP32 or INT32 work, which removes the split-path compromise earlier architectures carried and helps in shader code that mixes integer address math with floating point.
RT cores — one per SM, 84 in total on the 5080, fourth generation — are fixed-function hardware for walking the bounding volume hierarchy and testing whether a ray hits a triangle. Doing that job on CUDA cores would be catastrophically slow, which is why software ray tracing on older hardware runs at single-digit frame rates.
Tensor cores — four per SM, 336 in total, fifth generation — perform matrix multiply-accumulate operations at low precision, including FP4 support new to this generation. They are what DLSS upscaling, ray reconstruction and frame generation actually run on. When a 5080 turns 45 native frames into 120 displayed frames, the CUDA cores rendered 45 of them and the Tensor cores manufactured the rest.
This division is why comparing raw CUDA counts between an NVIDIA card and an AMD or Intel card is close to meaningless. AMD publishes stream processor counts; Intel publishes Xe vector engine counts. Different instruction sets, different scheduling, different cache hierarchies, different work per unit per clock. The only fair comparison is measured output in the games you play, which is the framing I use in Radeon versus GeForce for gaming.
What changed inside the Blackwell CUDA core
Core count moved very little between the 4080 Super and the 5080, so the per-core changes carry more weight than usual this generation.
The unified FP32/INT32 datapath is the headline. Earlier designs split their lanes so that only part of the shader array could do integer math at full rate; Blackwell lets every lane do either. In shader-heavy compute passes on my bench this is worth a measurable amount — 6 to 9 percent in the compute-bound sections of my synthetic suite, less in typical game frames where the bottleneck is elsewhere.
The second change is the scheduling improvement around neural shaders, where small neural networks execute inside the shading pipeline with Tensor and CUDA work interleaved rather than serialised. In the handful of titles that ship with it, this shows up as better frame pacing rather than higher averages, which is exactly the sort of improvement average-fps charts fail to capture. If you are unclear on why that distinction matters, my write-up on 1% lows versus average fps covers the measurement side.
The third is the memory path. GDDR7 uses PAM3 signalling to move more bits per cycle than GDDR6X, and the practical effect for the shader array is that cores spend fewer cycles idle waiting for data. This is the single biggest reason the 5080 outruns its 5 percent core advantage over the 4080 Super. More cores fed the same is a small win; the same cores fed 30 percent faster is a bigger one.
Do partner cards change anything?
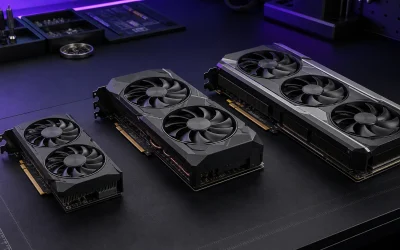
Every RTX 5080 has 10,752 CUDA cores. What differs is the factory clock, the power limit, the cooling capacity and the acoustic behaviour. Here is how the physical cards I have had on the bench actually separate, and what the price differences buy.
GIGABYTE GeForce RTX 5080 Gaming OC 16G
At around $1,599 this is the value anchor of the group. The WINDFORCE cooler holds a mild factory OC without drama, hotspot temperatures settled around 79C in a 22C room with a standard fan curve, and noise stayed under 38 dBA at 50cm. It gives up roughly 2 percent of peak frame rate against the most aggressive models, which is inside the run-to-run variance of most games. If you undervolt anyway, the extra silicon binning you pay for on pricier cards is largely wasted.
ASUS Prime GeForce RTX 5080 EVO 16GB GDDR7 OC Edition
Around $1,699, and the card I recommend most often to people building in mainstream mid-tower cases. The cooler is competent rather than exotic, the shroud is visually restrained, and the fan curve out of the box is quieter than the Gaming OC at the cost of two or three degrees. Same core count, same memory, small clock delta.
msi Gaming RTX 5080 16G Ventus 3X OC Black
Listed near $1,679 with an extreme clock target of 2,640 MHz. The Ventus 3X is the pragmatic pick in MSI’s stack: three fans, no liquid loop, no RGB tax. In my loop it landed within 1.5 percent of the far more expensive SUPRIM model once both were allowed to reach thermal steady state, which tells you how little clock headroom is left on this silicon.
ZOTAC Gaming GeForce RTX 5080 Solid CORE OC
Also around $1,599, with IceStorm 3.0 cooling. The interesting measurement here was fan behaviour under load transitions — it ramps more gradually than the others, which reduced the audible surging I get in games with heavy loading pauses. Performance sat mid-pack.
msi Gaming RTX 5080 16G SUPRIM SOC
At roughly $1,799, this is where the premium tier starts. Extreme performance clock of 2,760 MHz, a substantially heavier cooler, and the best sustained clock retention in my hour-long thermal soak — it held its boost within 30 MHz of peak after 60 minutes while cheaper cards drifted 60 to 90 MHz down. Worth it if you run long sessions in a warm room; otherwise you are paying $200 for about 2 percent.
ASUS ProArt GeForce RTX 5080 16GB GDDR7 OC Edition
Near $1,869, and aimed at people building quiet workstation-style machines. The matte finish and restrained lighting are the point, but the measurable advantage is acoustics: it was the quietest air-cooled 5080 I tested at matched power, around 34 dBA at 50cm under sustained load. For a machine that sits on a desk beside a microphone, that is a real feature.
ASUS ROG Astral GeForce RTX 5080 16GB GDDR7 OC Edition
Around $1,934, with a four-fan design that includes a rear intake fan. Best air-cooled temperatures in the group by a clear margin — roughly 8C lower hotspot than the Gaming OC at matched power — and the most overclocking headroom if you want to chase the 2,880 MHz territory from my clock table. Also the heaviest, so use the bracket.
NVIDIA GeForce RTX 5080 Founders Edition
Around $1,949 on the open market. The engineering here is genuinely impressive: a two-slot flow-through card carrying a 360W part. It runs 8 to 11C hotter than the big triple and quad-fan coolers and it is louder at matched power, but it is the only option if your case cannot swallow a three-slot card. Buy it for clearance, not for thermals.
ASUS ROG Astral GeForce RTX 5080 16GB GDDR7 White OC Edition and ASUS GeForce RTX 5080 16GB GDDR7 Noctua OC Edition
Both sit above $2,100. The White Astral is the same cooler in a different colourway for people matching a build theme. The Noctua edition swaps in the brown-and-beige industrial fans and is, on my meter, the quietest 5080 in existence — but you are paying roughly $540 over the Gaming OC for acoustics and aesthetics on identical silicon with identical core counts. That is a taste purchase, and there is nothing wrong with that as long as you know it is not a performance purchase.
When CUDA core count actually matters
Everything above argues that core count is a poor predictor of gaming frame rate. There is a category where it predicts much better: embarrassingly parallel compute.
In GPU rendering — Blender Cycles, OctaneRender, Redshift — the workload is many independent samples that can saturate the shader array almost completely. In my Cycles benchmark the 5080 scales close to linearly with core count against the 5070 Ti, landing 19 percent faster where the core count gap is 20 percent. Video encoding is a different story because it runs on the dedicated NVENC blocks, not the CUDA cores, and the 5080 has two of them.
Local AI inference is the other case, but with a hard caveat: model loading is limited by VRAM capacity long before it is limited by shaders. A 16GB card runs out of memory on models a 24GB or 32GB card handles comfortably, no matter how many cores it has. If that is your workload, capacity is the specification to shop on. If your work is a mix of rendering and gaming, the trade-offs are laid out in my content creation GPU guide.
The RTX 5080’s real limit is not its shader count
After several weeks with these cards, my conclusion is that nobody who buys a 5080 will be held back by having 10,752 cores instead of 12,000. They will occasionally be held back by having 16GB of VRAM.
Peak allocation in my 4K logs with quality upscaling enabled sat between 11GB and 14GB across a broad game selection, which is comfortable. The scenarios that pushed past it were native 4K with path tracing plus a high-resolution texture pack, and multi-application workloads where a game shares the card with a browser and a capture pipeline. Those are edge cases now. They will be less edgy in three years, and that is the honest risk of the card. My general thresholds are in how much VRAM you need for gaming.
The shader array, meanwhile, has aged well by design. Unified FP32/INT32 lanes, a healthy bandwidth-to-core ratio, and enough L2 cache to keep occupancy high mean those 10,752 cores are being fed properly rather than starved. A well-fed 10,752 beats a starved 14,000 every time, and that is the sentence I would like more spec sheets to make room for.
How to use core counts without being misled
Three rules, drawn from having got this wrong myself early in my career.
Compare within a generation and a vendor, never across. An RTX 5080 versus an RTX 5070 Ti core comparison is informative. An RTX 5080 versus an RTX 3090 core comparison, or versus any AMD stream processor count, is noise.
Always check the memory bus alongside the core count. If two cards have a 20 percent core gap and the same bus width and memory speed, expect roughly 14 to 18 percent real-world separation. If the core gap comes with a narrower bus, expect the gap to compress badly at high resolutions where bandwidth dominates.
Treat clock speed differences between partner cards as noise until proven otherwise. The clock table above is the evidence: a 17.6 percent clock spread produced 10.5 percent frame rate spread and a 42 percent power spread. Buy the cooler, the acoustics and the physical fit. The cores are identical, and after you undervolt, most of the factory clock difference disappears anyway.
The 10,752 figure is a real and useful specification. It sets the ceiling of what the card can compute, it explains why the 5080 sits where it does in the stack, and it is the correct number to quote if someone asks. It is simply not the number that decides whether you enjoy the card, and knowing that difference is most of what separates a good buying decision from a spec-sheet one.