
An FPS counter overlay displays your current frame rate on screen during gameplay, and the right choice depends on how much extra diagnostic detail you want alongside that number. Built-in options like Windows’ Game Bar or a game’s own display are the simplest, while MSI Afterburner and Linux’s MangoHud provide fuller monitoring including frame time and hardware sensors for more thorough troubleshooting, and knowing which category you actually need saves you from either under- or over-configuring your setup.
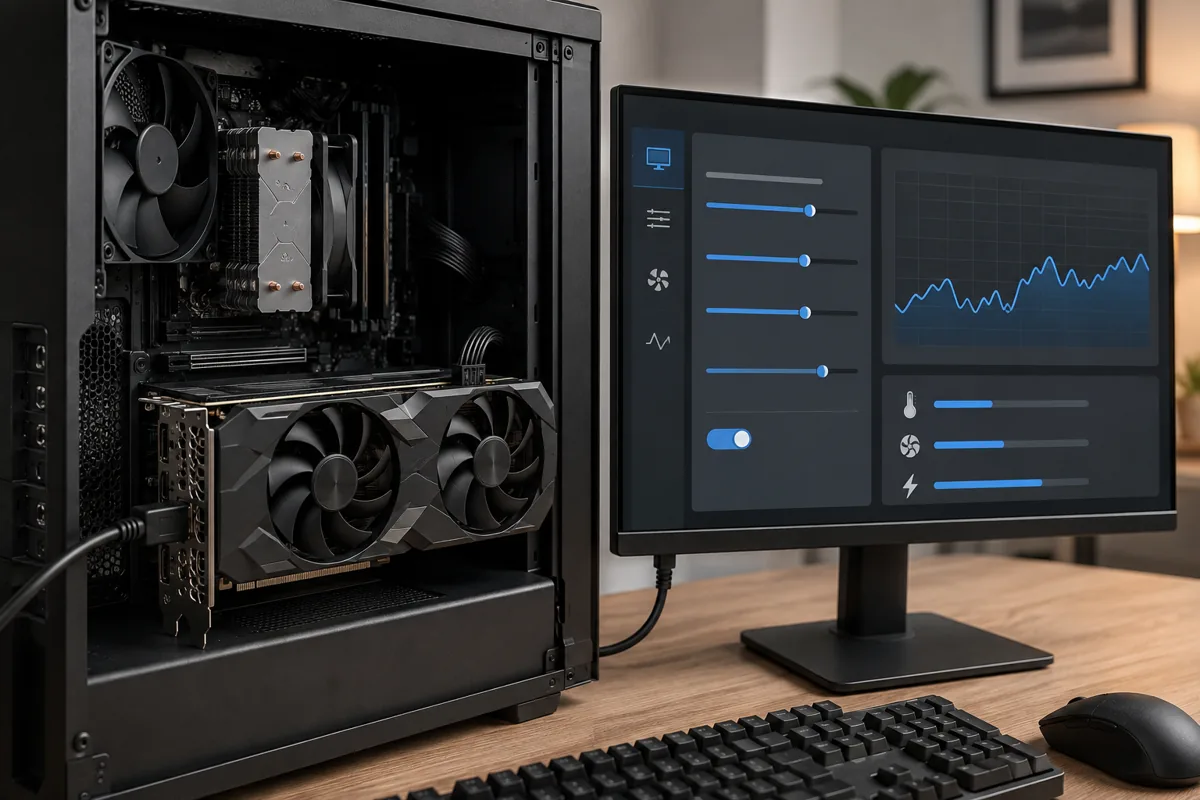
Top 3 picks at a glance
Quick answer
For a quick, no-setup frame rate check on Windows, Game Bar’s built-in performance overlay works immediately with no installation. For ongoing monitoring with more detail — frame time, temperatures, usage percentages — MSI Afterburner’s overlay is the standard, widely used choice. On Linux, MangoHud is the equivalent tool most gaming distros include or make easily available.
As an Amazon Associate we earn from qualifying purchases at no extra cost to you.



| Tool | Platform | Detail level |
|---|---|---|
| Windows Game Bar | Windows | Basic, built-in |
| MSI Afterburner | Windows | Full (FPS, frame time, sensors) |
| MangoHud | Linux | Full (FPS, frame time, sensors) |
Windows Game Bar’s built-in overlay
Windows’ Game Bar includes a performance overlay showing frame rate and basic hardware utilization without requiring any additional software installation, accessible through the same overlay covered in our Game Bar troubleshooting guide if you run into issues getting it to appear.
This is the simplest option for a quick check — confirming a game is running at a reasonable frame rate, or verifying a setting change had an effect — without installing a third-party tool, which is convenient if you don’t need detailed frame time or sensor data.
Game Bar’s overlay is less detailed than dedicated tools like Afterburner, lacking frame time graphs and deeper hardware sensor readouts, so it’s better suited to a quick sanity check than the kind of sustained monitoring useful for diagnosing subtle stutter or thermal issues.
A reasonable way to decide whether Game Bar’s more limited overlay is actually sufficient for your needs: if your question is simply “is this game running around the frame rate I expect,” Game Bar answers that in a few seconds with zero setup. If your question is closer to “why does this feel inconsistent even though the average FPS looks fine,” you need frame time data Game Bar doesn’t show, and one of the fuller tools covered below is the more appropriate choice from the start rather than something to reach for only after Game Bar’s number turns out unhelpful.
MSI Afterburner and RivaTuner Statistics Server
MSI Afterburner’s overlay, enabled through its bundled RivaTuner Statistics Server component covered in our Afterburner setup guide, is the most widely used third-party FPS overlay on Windows, and it works with GPUs from any manufacturer despite the MSI branding.
Beyond basic FPS, it displays frame time, CPU and GPU usage percentages, temperatures, clock speeds, and power draw, all configurable in terms of which stats appear and how the overlay is positioned, giving far more diagnostic context than a basic counter alone.
The overlay’s layout can also be arranged in a compact single-line format or a fuller multi-row grid depending on how much screen space you’re comfortable dedicating to it, and this is worth revisiting once you’ve used it for a while — many players start with a fuller, more detailed layout while learning what each stat means, then trim it down to just the two or three metrics they actually reference regularly once they’ve built a sense of what’s normal for their specific system.
This depth of information is particularly useful when frame rate alone doesn’t explain a performance complaint — a game showing a reasonable average FPS but still feeling inconsistent is much easier to diagnose with frame time data visible alongside the average number.
Because it’s a system-wide overlay rather than a per-game feature, it works consistently across most games that don’t specifically block third-party overlays, making it a reliable default choice if you want one tool across your whole library rather than relying on each game’s own, inconsistent built-in options.
Its logging feature, separate from the live overlay display, is worth setting up if you want to review a session’s data afterward rather than only watching it in real time — recording a full play session to a log file and reviewing the frame time graph afterward often reveals a brief stutter you didn’t consciously notice during play but that shows up clearly as a spike once you look at the recorded data with fresh eyes.
Afterburner’s overlay also lets you configure separate colors or highlighting thresholds for specific stats, so a temperature or frame time value crossing into a concerning range changes color rather than requiring you to actively watch a plain number the whole session. Setting this up once for the metrics you care about most — a GPU temperature threshold a few degrees below your card’s throttle point is a common choice — turns the overlay into more of a passive warning system you can glance at occasionally rather than something demanding continuous attention throughout a session.
MangoHud on Linux
MangoHud is the standard overlay tool on Linux gaming distros like Bazzite, Nobara, and CachyOS, providing frame rate, frame time, CPU and GPU usage, and temperature readouts similar in scope to what Afterburner provides on Windows, and it’s typically available as a package on all three distros.
It can be toggled per-game through Steam’s launch options or configured globally through a configuration file, and its display can be customized in terms of which metrics show and their layout, similar to the configurability Afterburner offers on Windows.
Because Proton-run Windows games and native Linux games both benefit from MangoHud’s monitoring, it serves as a consistent tool across a mixed library the way Afterburner does on Windows, rather than needing different monitoring approaches for different types of games.
If you’re new to gaming on Linux, our guide to the best Linux distros for gaming covers where MangoHud fits into the broader toolkit alongside GameMode and Proton-GE.
MangoHud’s configuration file approach, rather than a graphical settings panel, is a meaningful difference from Afterburner’s interface worth knowing upfront if you’re coming from Windows — customizing which stats appear and how the overlay looks involves editing a text-based config file with documented options, rather than clicking through menus. This is a one-time setup cost rather than an ongoing inconvenience, and copying a known-good example configuration from the distro’s own documentation is generally faster than building one from scratch by reading through every available option individually.
A specific Linux-relevant use for MangoHud worth knowing about: because shader compilation stutter is a more common first-session issue on Linux than on Windows (covered in more detail in our Linux distro guide), MangoHud’s frame time graph is a particularly useful way to visually distinguish between one-time shader compilation stutter, which shows up as isolated spikes that fade after a level’s first playthrough, and a persistent, recurring stutter pattern that points to a different, ongoing cause instead.
In-game built-in FPS counters
Many games include their own built-in FPS display as a settings toggle, which is convenient since it requires no additional software, but it’s limited to that specific game and typically shows less detail than a dedicated monitoring tool — often just the frame rate number without frame time or hardware sensor context.
Relying solely on in-game counters means switching between different games’ different display conventions and detail levels, which is less consistent than a single system-wide overlay tool that behaves the same way across your whole library.
In-game counters are still useful as a quick reference, particularly since they’re guaranteed to be compatible with that specific game’s anti-cheat system in a way a third-party overlay tool sometimes isn’t, since the game’s own developer built and tested it as part of the title itself.
A practical reason to keep at least one in-game counter enabled even if you primarily rely on a system-wide tool like Afterburner: it serves as a quick cross-check if you ever suspect a system-wide overlay is reporting an inaccurate number for some reason, since a large, persistent discrepancy between the two is a useful signal that something about the monitoring setup itself, rather than the game’s actual performance, deserves investigation.
Choosing based on anti-cheat compatibility
Some competitive games with strict anti-cheat systems block third-party overlay hooks by design, which can prevent Afterburner’s or MangoHud’s overlay from appearing even though the underlying monitoring software itself isn’t doing anything wrong — this is a deliberate anti-cheat design choice, not a bug in the overlay tool.
For games where this is a known issue, the game’s own built-in FPS counter, if it has one, or Windows’ Game Bar (which is a first-party Microsoft tool and sometimes has different compatibility than third-party overlays) may be more reliable options than a third-party overlay.
Checking a specific competitive game’s community forums or official support pages for known overlay compatibility issues before assuming your monitoring tool is broken saves troubleshooting time, since this is a common and well-documented category of issue across many competitive titles.
A reasonable workaround for a mixed library that includes both anti-cheat-protected competitive titles and single-player games: keep Game Bar enabled as a fallback specifically for the games where third-party overlays are blocked, while using Afterburner’s fuller overlay for everything else. This avoids the frustration of assuming your main monitoring tool is broken every time you launch a specific competitive title, when the actual cause is a known, expected limitation rather than a configuration mistake on your end.
It’s also worth checking whether the anti-cheat-blocked game has its own built-in performance display as a compromise — many competitive shooters do include at least a basic frame rate counter specifically because they know third-party overlays won’t function, which gives players some visibility without needing to bypass the anti-cheat’s overlay restrictions.
Using overlay data to actually diagnose problems
A frame rate number alone tells you less than frame rate paired with frame time, since two systems can show the same average FPS while one has much more consistent frame delivery than the other — the frame time graph, available in Afterburner and MangoHud but not basic counters, reveals this difference visually.
Correlating a frame rate dip with a simultaneous temperature spike or clock speed drop, visible in a full monitoring overlay, helps distinguish a thermal throttling issue from a different cause like a CPU bottleneck or a game-specific stutter, which a basic FPS-only counter can’t help you distinguish.
If you’re troubleshooting a specific performance complaint, our guide to fixing FPS drops covers using this kind of overlay data as part of a broader diagnostic process rather than just displaying a number for its own sake.
A specific worked example of why the pairing matters: two systems could both report a 90 FPS average in the same demanding scene, but one shows a tight, consistent frame time graph while the other shows regular spikes to double or triple the normal frame time even though the average works out the same. Only the frame time data reveals which system actually feels smoother to play, since the average alone treats a handful of severe spikes and a stream of consistently minor variance as equivalent when a player’s felt experience of the two is very different.
When a simple counter is all you need
If you’re not troubleshooting anything specific and just want a general sense of performance during casual play, a basic counter — Game Bar’s overlay or a game’s own built-in display — is sufficient and avoids the extra configuration and screen clutter of a fuller monitoring tool.
Reserve the more detailed tools for situations where you’re actively diagnosing a problem, comparing before-and-after a settings change, or specifically curious about hardware behavior beyond just the frame rate number itself.
A middle-ground habit worth adopting even if you don’t need full monitoring constantly: install and configure Afterburner’s overlay once, but keep it toggled off by default using its configurable keyboard shortcut, so it’s available in a couple of keystrokes the moment you actually need the deeper data rather than requiring a fresh install or setup process in the middle of troubleshooting something.
Troubleshooting overlay display issues
Overlay doesn’t appear at all in a specific game: check whether that game uses strict anti-cheat known to block overlays, and confirm the underlying service (RTSS for Afterburner) is actually running in the background.
Multiple overlays conflict or cause display glitches: disable all but one overlay tool and re-enable them individually to identify which combination is causing the conflict, similar to the approach covered in our Game Bar troubleshooting guide.
FPS number looks inconsistent with what the game feels like: check frame time alongside average FPS, since a reasonable average can still mask inconsistent frame delivery that a single averaged number doesn’t reveal on its own.
Overlay position or size is wrong after a driver or Windows update: reconfirm the overlay’s display settings within the relevant tool, since some updates can reset third-party overlay configuration.
Overlay text is too small or hard to read at higher resolutions: most tools including Afterburner and MangoHud let you scale the overlay’s text size independently from your display resolution — on a 4K display in particular, the default scale is often set conservatively and worth increasing for readability during actual gameplay rather than only when you stop to squint at it.
Different tools show slightly different FPS numbers simultaneously: small differences in sampling and averaging method between tools are normal — use one tool consistently for a given comparison rather than treating small discrepancies as a problem.
Frequently asked questions
What’s the difference between an FPS counter and a full monitoring overlay?
A basic FPS counter shows only frame rate, while a full monitoring overlay like MSI Afterburner’s or HWiNFO64’s also displays frame time, hardware temperatures, clock speeds, and usage percentages, giving much more diagnostic context alongside the raw frame rate number.
Does running an FPS overlay reduce my actual frame rate?
The overhead from a lightweight overlay tool is minimal on most modern systems and generally not something you’d notice in practice, though extremely low-end hardware could theoretically see a very small, usually negligible impact.
Which overlay works across the most different games?
System-wide tools like MSI Afterburner’s overlay (via RivaTuner Statistics Server) or Windows’ own Game Bar work across most games that don’t specifically block overlays, since they hook into the system’s rendering pipeline rather than relying on a specific game’s built-in feature.
Why doesn’t my FPS overlay show up in some competitive games?
Some games with strict anti-cheat systems deliberately block third-party overlay hooks, including legitimate monitoring tools, as part of their anti-cheat design. This affects most external overlay tools similarly and isn’t specific to any one piece of software.
Should I trust the FPS number shown in the overlay, or the game’s own display?
Both are typically reading similar underlying frame data and should closely agree; a significant, persistent discrepancy between two tools measuring simultaneously is worth investigating, but small differences in averaging method are normal and not cause for concern.


